The Sanyo Chemical Group uses water resources in various aspects of chemical product manufacturing.
Recognizing that our group's business activities share a close connection with water resources, we are committed to conserving and making effective use of water, as well as reducing water pollution arising from wastewater emitted outside our business sites.
The results of the water risk assessment using Aqueduct, an assessment tool published by the World Resources Institute (WRI), confirm that the risk levels for all domestic and international production sites are not at the "extremely high" level.
Policy
We are currently working to reduce water consumption, which is one of the goals of Environmental Action Plan 21-24.
In order to control the emission of water pollutants, we will prevent leakage within our business sites and monitor the pollutants in wastewater to stay within legal limits.
System
The Responsible Care Dept. of the Responsible Care Division serves as the secretariat for managing progress and sharing information concerning water conservation and other items we are addressing at each business site. We will replicate these results at other overseas offices.
Water Consumption Targets and Results
*Horizontally scrollable
| Environmental Action Plan 21-24 |
FY2019 (base year) |
FY2020 | FY2021 | FY2022 | FY2023 | Evaluation | FY2024 (targets) |
|---|---|---|---|---|---|---|---|
| Water consumption (thousand ㎥) |
4,354 | 4,269 | 4,295 | 4,333 | 3,973 | Within target level | 4,136 or less |
| Percentage reduction (compared to FY2019) |
- | 2.0% | 1.3% | 0.5% | 8.8% | 5% or above |
Scope: All facilities of Sanyo Chemical Industries, Ltd., all domestic subsidiaries & affiliates, and overseas subsidiaries & affiliates that have production bases*
- SDN.BHD. Sanyo Chemical Texas Industries, LLC; Sanyo Kasei (Thailand) Ltd.; Sanyo Kasei (Nantong) Co., Ltd.; San-Dia Polymers (Nantong) Co., Ltd.; SDP GLOBAL (MALAYSIA) SDN. BHD.
Reduction of Water Intake Volume and Water Consumption
Approximately 90% of the water used by our group is industrial water. Industrial water is mainly used for heating and cooling water, cleaning water, and drainage water used in manufacturing facilities and ancillary facilities.
Tap water is used for polymerization water for polymer production and as dilution water for products. It is also used to clean products, intermediates, and manufacturing equipment. No groundwater or sea water is used.
Water consumption in FY2023 decreased both in Japan and overseas, totaling 3,973 thousand ㎥ (down 9% YoY).
Although our production volume decreased by approximately 5% from the previous fiscal year, the heating and cooling water used in manufacturing facilities and ancillary facilities is not affected by increases or decreases in production volume. As such, it is easy to see the effects of our water conservation and water recycling measures. We will continue to make improvements in this area.
Changes in water intake volume

Changes in water discharge

*Horizontally scrollable
Breakdown of Water Intake
| Water resources | Unit | FY2019 | FY2020 | FY2021 | FY2022 | FY2023 | FY2024 (targets) |
|---|---|---|---|---|---|---|---|
| Tap water | thousand ㎥ | 387 | 395 | 421 | 400 | 334 | - |
| Industrial water | 3,967 | 3,873 | 3,874 | 3,933 | 3,639 | - | |
| Surface water (oceans, lakes, rivers) | 0 | 0 | 0 | 0 | 0 | - | |
| Groundwater | 0 | 0 | 0 | 0 | 0 | - | |
| Total water intake | 4,354 | 4,269 | 4,295 | 4,333 | 3,973 | 4,136 or less |
Reduction of water pollutant emissions
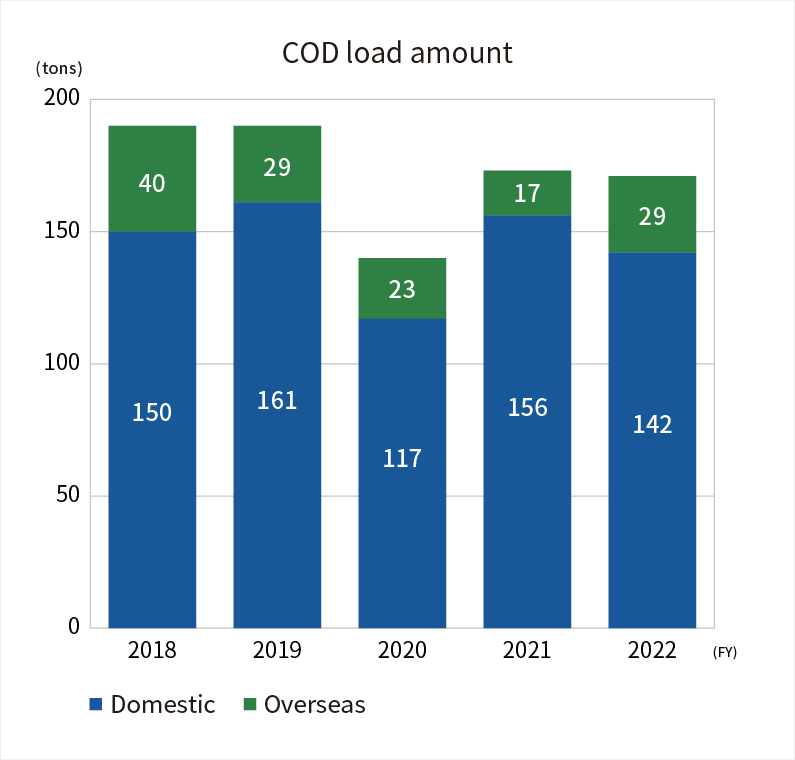
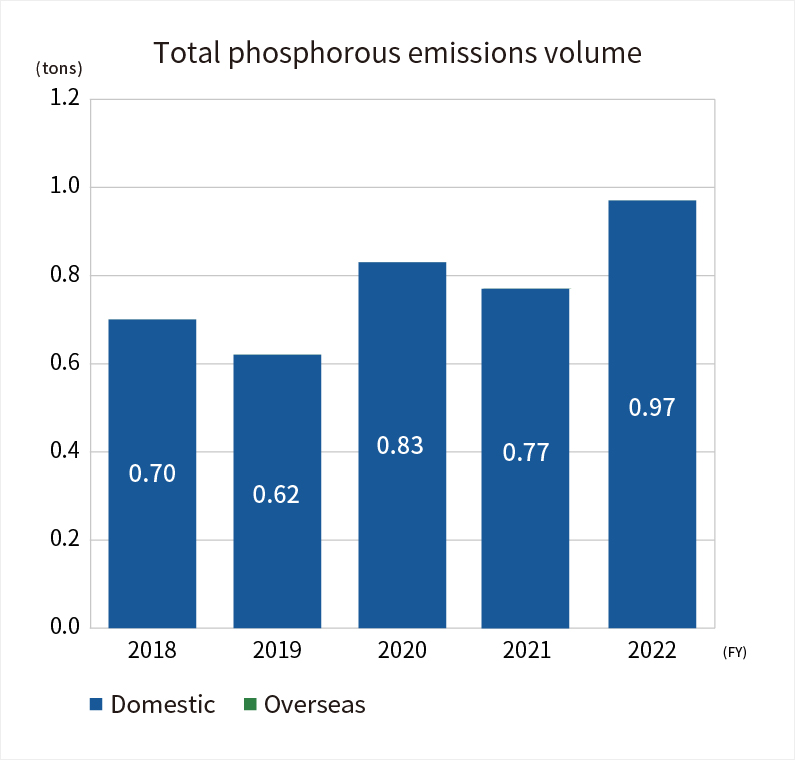
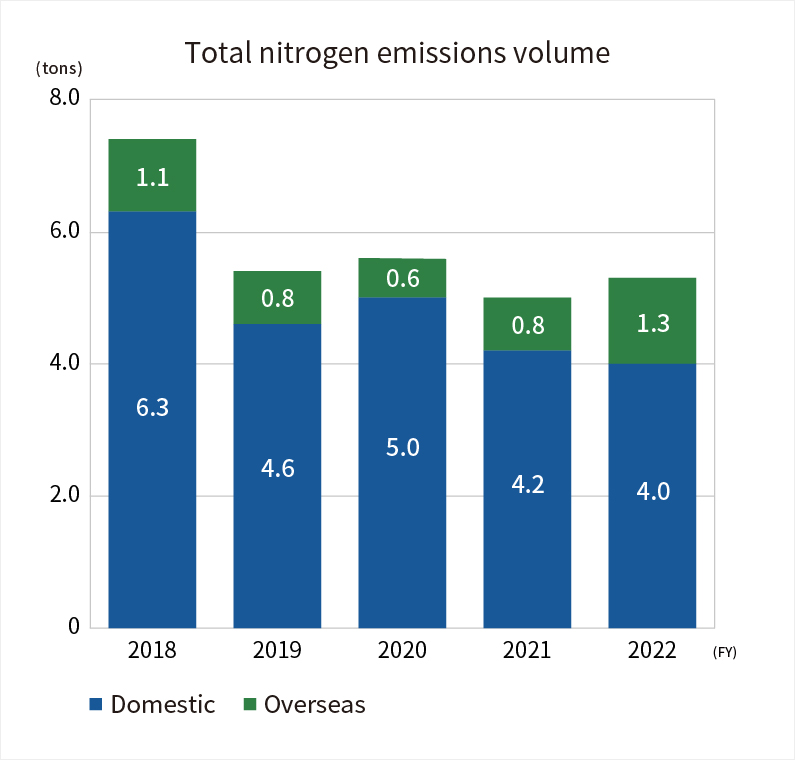
Along with preventing leakage within our business sites, we ensure that wastewater is emitted outside these sites only after monitoring the concentration of pollutants in the wastewater, which includes measuring COD, and properly treating wastewater via treatment facilities. We keep these concentrations within regulatory limits, and no regulatory violations concerning water quality occurred in FY2023.
COD

Total phosphorus emissions

Total nitrogen emissions

*Horizontally scrollable
Emission Areas and Environmental Impact (domestic) (FY2023)
| Unit | Nagoya area | Kawasaki area | Kashima area | Kyoto area | Kinuura area | |
|---|---|---|---|---|---|---|
| Business sites |
Nagoya Factory SDP Global Co., Ltd. SAN NOPCO LIMITED |
San Chemical Co., Ltd. |
Kashima Factory San-Petrochemicals Co., Ltd. |
Kyoto Factory, Head Office, Head Office Research Laboratory, Katsura Research Laboratory |
Kinuura Factory | |
| Emission areas | Ise Bay | Tokyo Bay | Sewerage | Sewerage | Sewerage | |
| Water discharge | thousand ㎥ | 1,671 | 111 | 788 | 141 | 1 |
| COD | tons | 8.7 | 2.4 | 102.8 | 1.4 | 0.0 |
| Total phosphorus | tons | 0.2 | 0.0 | 0.4 | 0.1 | 0.0 |
| Total nitrogen | tons | 1.3 | 0.3 | 1.3 | 0.1 | 0.0 |
Water conservation and recycling
To the extent possible, we constantly reuse polymerization water for polymer production and cleaning water for products and intermediates. We also reuse steam condensate as water. Each business site establishes its own area of focus for water conservation and recycling as part of efforts to reduce water consumption.
Products that contribute to water resource and water environment conservation
Our product lineup includes raw materials for water-saving compact detergents, polymer flocculants for wastewater treatment, and bases for biodegradeable shampoos. These contribute to water conservation, wastewater treatment, and biodegradability for above effective use of water resources.